CVRS
For my independent studies dissertation I decided to look at creating a virtual reality application that depicts the transmission of COVID-19 in a university setting. The application allows for the transmission of COVID-19 between AI agents, and visualises this by using a border outline. The work builds upon that of a previous university student who created the base VR application which showcases social distancing between the agents. The project that I carried out then adds the transmission of a virus, a different view to perceive this within, a schedule system for the agents to follow, and a way to export the transmission that occurred for validation. The main idea behind building the project was to discover if presenting the data in this way is suitable, and if it could be used to help display the potential transmission to the general public.
Transmission
The following paper served as the main inspiration for the way that transmission works within the application, the SIRI model is adapted changing an adjacency matrix for some parameters sampled at run time such as mask adoption, and distance. The equations derived for the compartmental models used are the following:
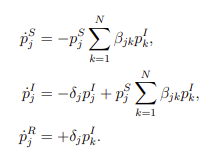
The compartments used follow the basics set out, a susceptible, infected, and removed compartment exist. The agents change states between these state maintaining a percentage chance that they are in each state. The agents may begin with each state in any chance, however all states for a given agent sum to 100%. For the simulations run a class of agents would start with all agents susceptible except for one who would start wholly in the the infected state. Then the agents in the susceptible state would transition into the removed state based on their interaction with the infected agent, and then into the removed state based on the recovery parameter. Within the model there is the beta parameter used, this is what replaces the adjacency matrix mentioned earlier to get a value from this the data from two agents at a given point in time are used, the equation is as follows:
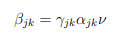
The three parameters in the equation are:
- A base infectivity parameter, this can be modified to make the virus more or less contagious
- A sampling of the distance between the two agents, the further away the agents are the less contagious on a quadratic scale, after a distance of 5m the virus is treated as having no effect
- An adjacency matrix based on mask adoption between the two agents
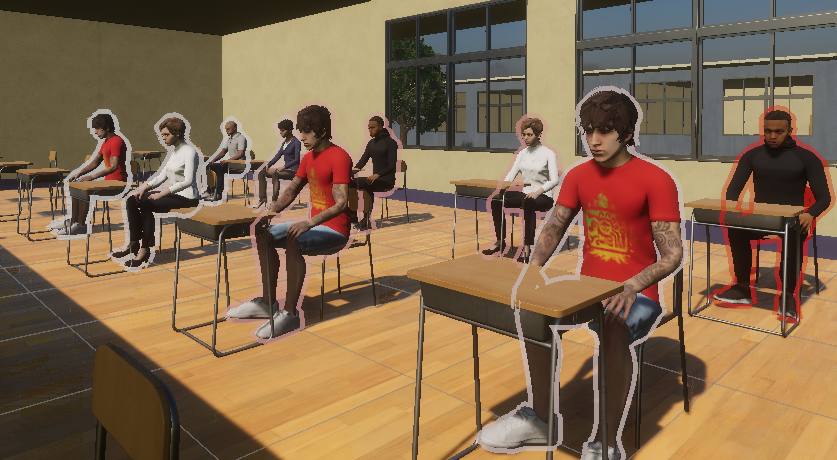
The combination of then allows the infection to be transmitted between agents, the outline then handles turning the infection chance into an outline of white to red where white is less infected and red more. This is then viewed from a top down perspective, with some UI that gives additional detail.
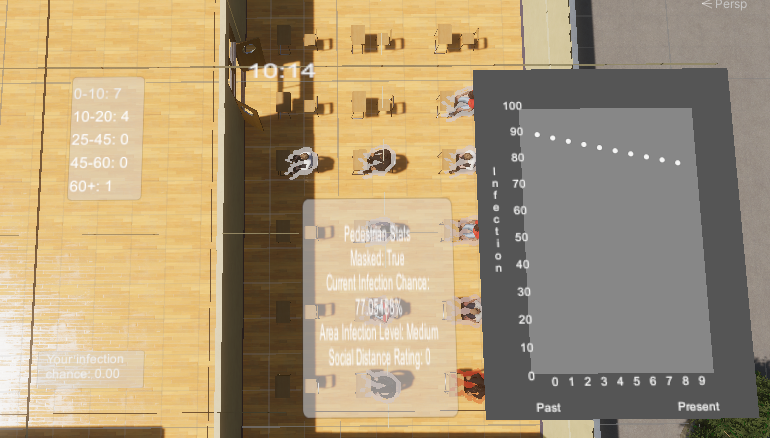
With all this in place the application shows the transmission of the virus between two agents. There are additionally schedules on top of this that then allows control of the agents in the scene. This allows for running of different scenarios, for example one scenario is created where 10 agents go to class for 2 hours then go home, all wear masks and a single agent begins as infected. Another identical scenario is created with the change that no agents wear masks. The simulation was then run and data exported into a JSON format then graphed in MATLAB to show the infection over time.
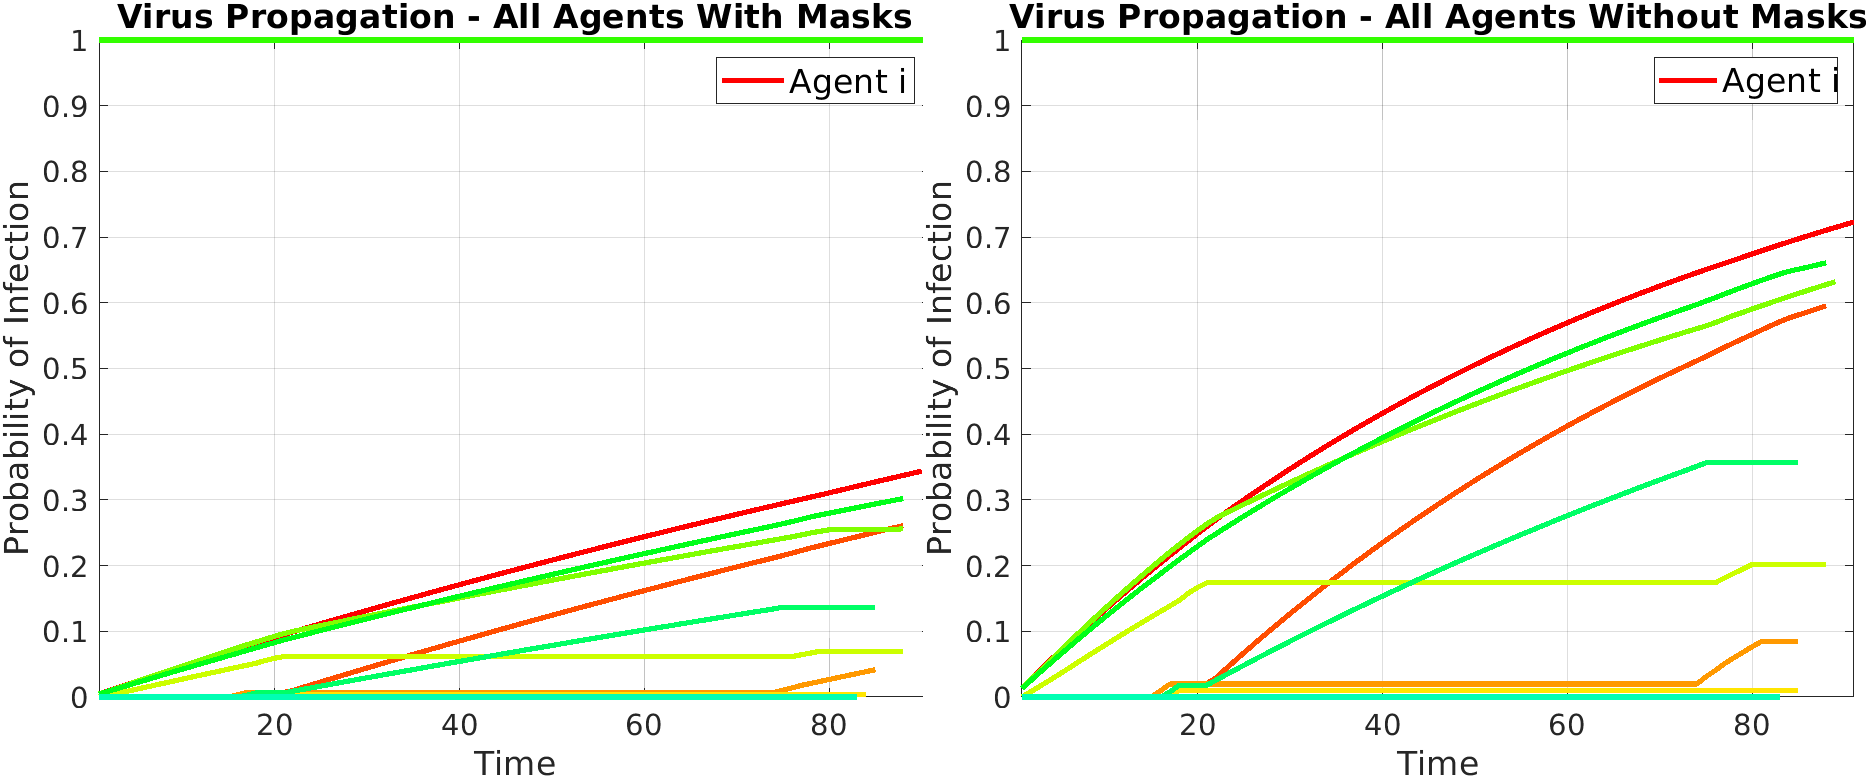
This helped to show that the simulation worked as expected, and that individual runs would produce the same results as can be seen by the similarity in when the infection changes between the two scenarios. There is more detail than has been divulged here, but this will be the stopping point for this post covering the transmission. The project was interesting to work on due to its mix of science, virtual reality, and computer science, and gave me a fair project to then write up about to produce a dissertation.